
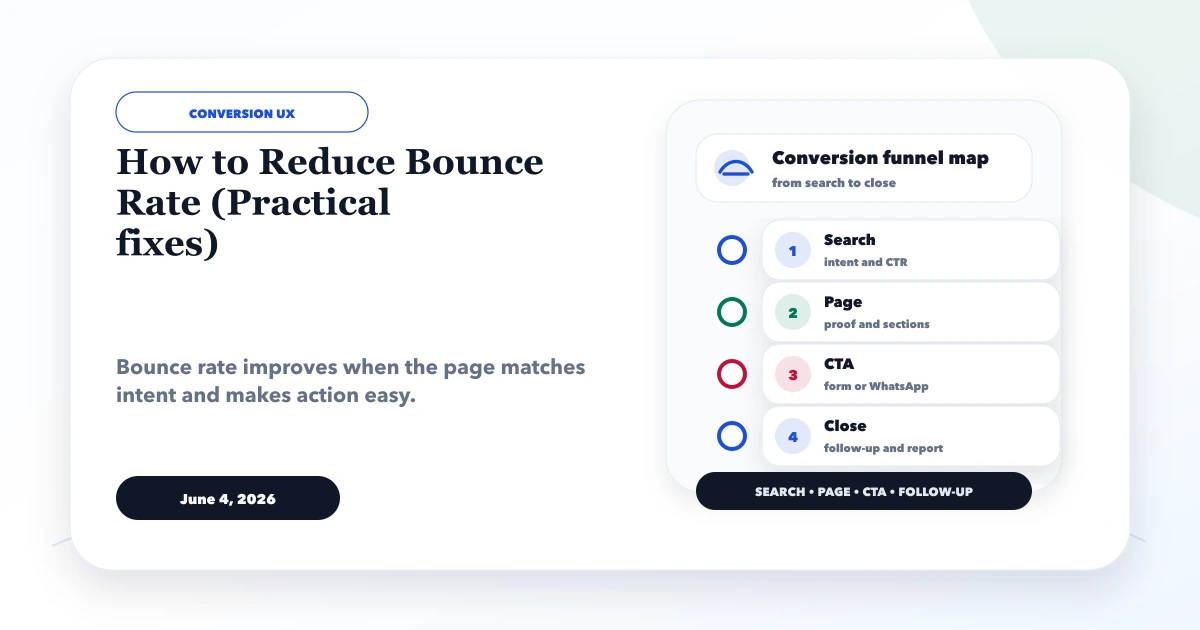
June 4, 2026
How to Reduce Bounce Rate: Practical Fixes
Reduce bounce rate by diagnosing search intent, mobile speed, content clarity, CTA friction, and tracking quality instead of chasing one sitewide number.
Read articlePublished Updated
Diagnose weak engagement by query, device, and page type; then improve intent match, first-screen clarity, speed, proof, navigation, and CTA tracking.
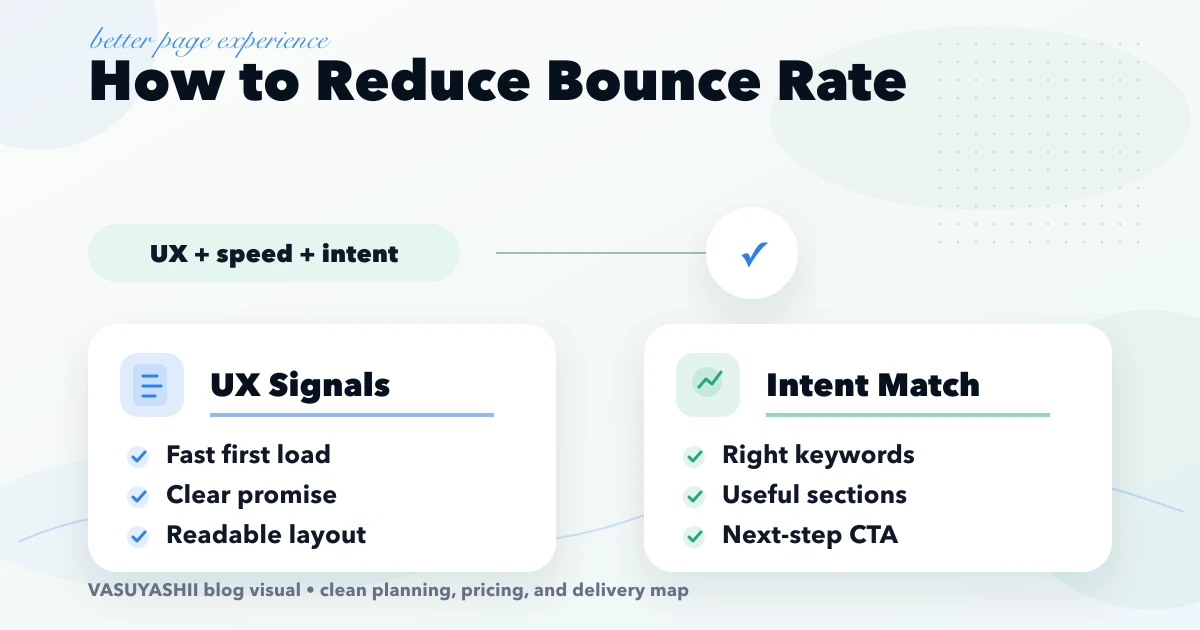
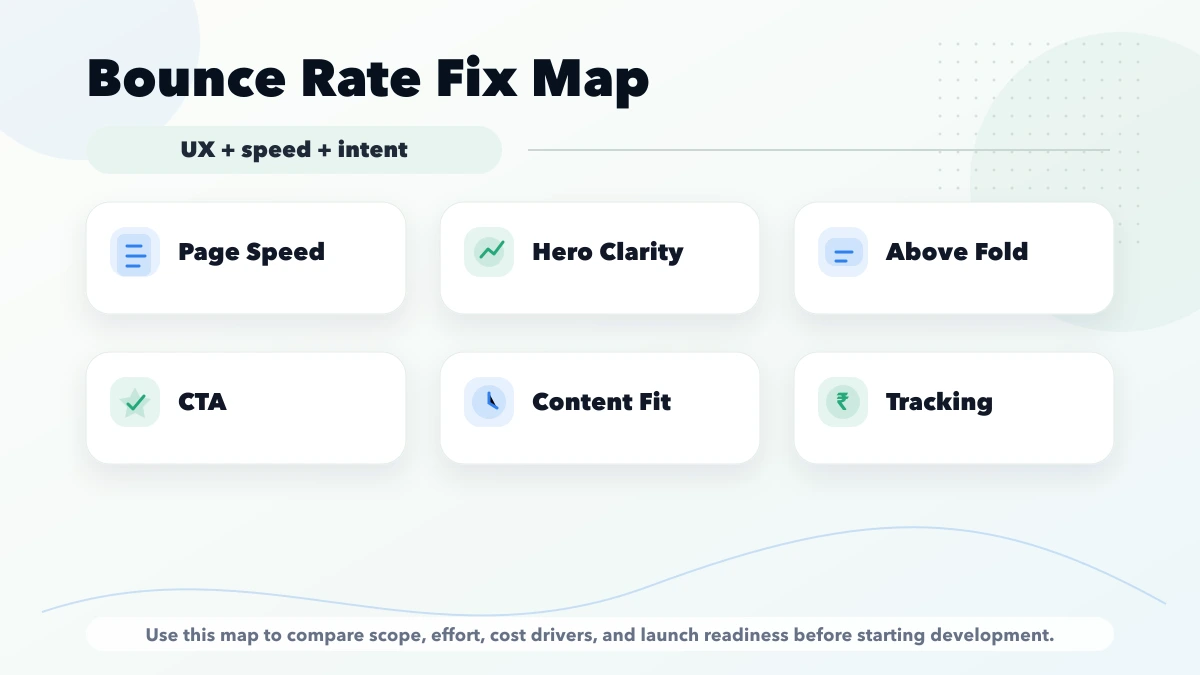
how to reduce bounce rate is important for business website owners who get traffic but visitors leave without clicking WhatsApp, forms, or service pages. To reduce bounce rate, you need to match search intent, improve first-screen clarity, load fast, and make the next action obvious. This guide is for Indian service businesses that want better engagement and more leads from existing traffic. This guide is written for Indian SMB owners who want practical scope, cost, timeline, and decision clarity without generic theory.
| Scope | Typical range |
|---|---|
| Bounce/UX audit | ₹10,000 to ₹30,000 |
| Landing page improvement | ₹25,000 to ₹80,000 |
| Full conversion and speed sprint | ₹80,000 to ₹2 lakh+ |
An overall bounce or engagement number can hide the real problem. Compare mobile and desktop, organic and referral traffic, branded and non-branded queries, new and returning visitors, and individual landing pages. A contact page may correctly end a visit after the user calls, while a service page with no next action has a different problem.
Check the search queries that lead to the page. If a cost query lands on a generic service overview, the visitor may leave because the answer is missing rather than because the design is weak.
Within the first viewport, users should identify the service, audience, outcome, and next step. Keep the main heading visible on first paint. Supporting animation should not delay the offer, move the CTA, or make the visitor wait for readable content.
Place one credible proof signal near the decision path: a relevant project, verified review source, practical process, or specific deliverable. Avoid stacking badges that cannot be checked.
Start with the actual LCP element, image dimensions, font loading, third-party scripts, and client JavaScript. Lazy-load below-fold media, but do not lazy-load the primary hero asset when it is needed immediately. Use field LCP, INP, and CLS where available; lab scores help reproduce issues but do not replace real-user data.
Fix one hypothesis at a time and keep a rollback note. For wider structure, see Website Development Delhi NCR and web application services.
A user may read a phone number, click WhatsApp, download a document, or find a complete answer without opening another page. Track these useful actions before calling the visit a failure. At the same time, do not use that possibility to excuse a service page with no proof or next step. Engagement metrics need business context and event validation.
The final decision should combine behaviour, conversion, and search-intent evidence.
In Google Analytics 4, bounce rate is the percentage of sessions that were not engaged sessions. Google defines an engaged session as one that lasts longer than ten seconds, has a key event, or has at least two page or screen views. Bounce rate is therefore the inverse of engagement rate, not simply “a visitor viewed one page.”
Read the current Google Analytics engagement and bounce-rate definition before comparing reports. Event setup, reporting identity, consent, internal-traffic filters, and date range can change what the number means.
Do not optimise the site-wide average first. Export landing page, source/medium, device, country, query, engagement, key events, and conversion data. Then group pages:
| Pattern | Likely question | First check |
|---|---|---|
| High relevant impressions, low clicks | Search snippet may not match intent | Title, description, and SERP competition |
| Good clicks, quick exits, no action | First screen may not fulfil the query | Message, proof, CTA, mobile layout |
| Mobile weaker than desktop | Speed or interaction friction | LCP, tap targets, menu, form, keyboard |
| Paid campaign weaker than organic | Ad-to-page mismatch | Campaign promise and landing-page variant |
| Good engagement, low enquiries | Conversion path may be weak | Offer clarity, proof, form, follow-up |
Annotate major campaigns, redesigns, tracking changes, and outages. Without that context, a chart can lead the team to “fix” a measurement change.
The first screen should identify the offer, audience, outcome, location where relevant, proof cue, and next action. A searcher asking for price needs scope drivers and realistic ranges; a searcher asking how a workflow works needs steps; a buyer comparing vendors needs deliverables, evidence, and decision criteria.
Avoid vague hero copy, autoplay media, intrusive popups, and animations that delay readable content. Keep the page’s main answer in server-rendered HTML where possible and make the primary action usable without waiting for decorative scripts.
Track form success after the server accepts a valid submission, not only when the submit button is clicked. Track phone, WhatsApp, email, demo, and booking actions with clear event names. Mark only genuine business outcomes as key events.
Test events in GA4 DebugView, then confirm they appear in Realtime and standard reports after processing. Exclude internal traffic carefully; an active developer filter can make testing appear broken if the test device is excluded.
Create an experiment log with page, segment, problem, evidence, change, expected outcome, launch date, and result. Prioritise changes that solve a visible mismatch:
Do not change copy, layout, analytics, and traffic source simultaneously if you need to understand the cause. Use enough time and traffic to avoid treating normal variation as a result.
There is no universal “good” bounce rate and no guaranteed uplift from a specific design change. Traffic intent, page type, tracking configuration, brand familiarity, device, and market all affect the metric. VASUYASHII can help with web application work, lead-first website development, analytics, and conversion flows, but any target should be based on a verified baseline.
Before approving a change, preserve a screenshot, page version, analytics date range, query segment, and event test. Review the result against qualified leads as well as engagement. If performance improves but form delivery breaks, or engagement rises while enquiry quality falls, the experiment did not achieve the business objective.
Use a minimum monitoring window suited to traffic volume rather than declaring success after a few visits. Low-traffic service pages may need qualitative evidence, Search Console trends, and sales feedback alongside analytics.
Start with a short discovery checklist that defines users, workflow, required outputs, and success metric.
Yes. A phased build is usually safer because it keeps cost and adoption under control.
Avoid building too many advanced features before the core workflow is tested with real users.
Compare exact deliverables, timeline, ownership, support, and reporting instead of only the final price.
No. Custom development is useful when workflow, roles, reports, or integrations are specific to your business.
Yes, if the first phase is scoped around one clear business problem.
Related Articles
June 4, 2026
Reduce bounce rate by diagnosing search intent, mobile speed, content clarity, CTA friction, and tracking quality instead of chasing one sitewide number.
Read article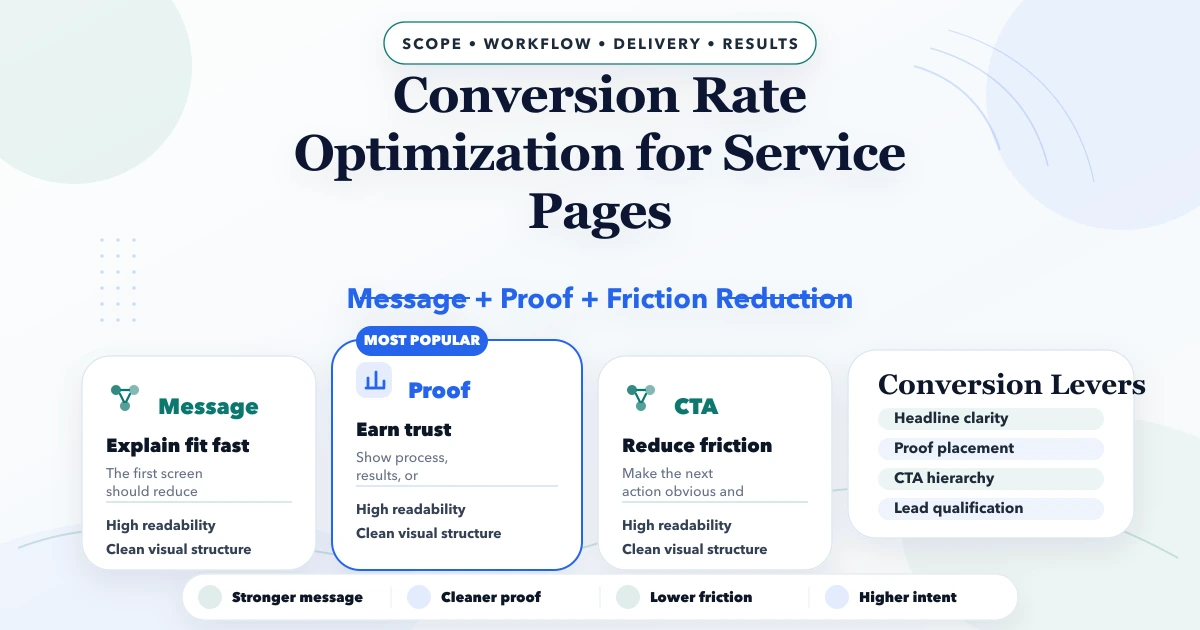
April 30, 2026
Conversion rate optimization for service pages with copy, UX, trust, CTA, pricing, and implementation guidance for better leads in 2026.
Read article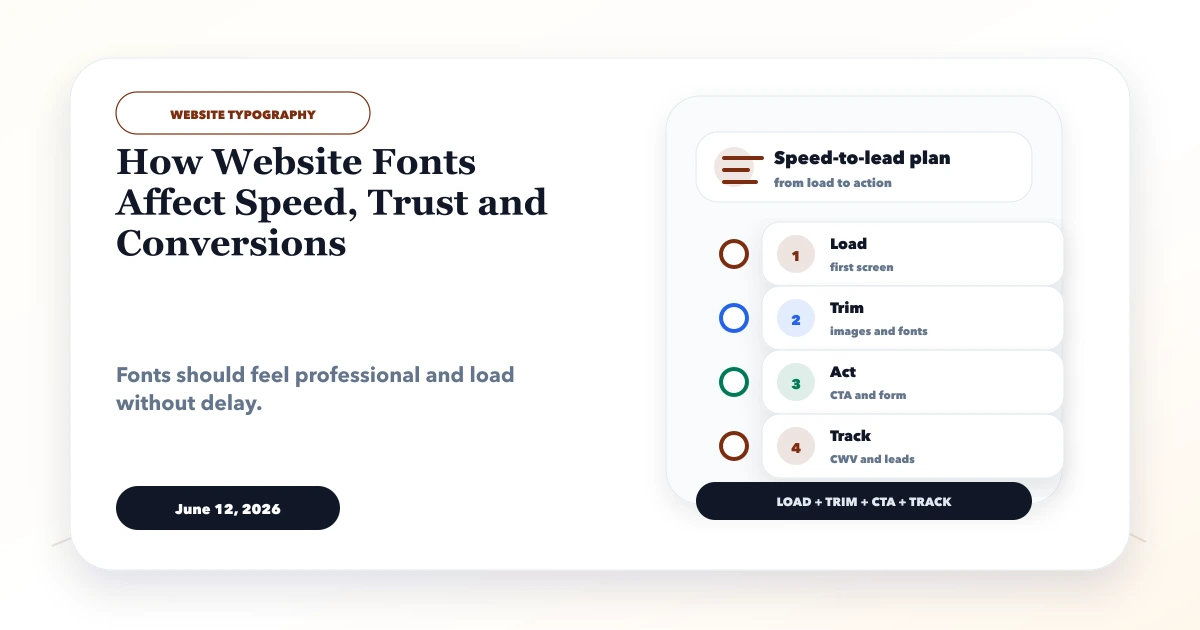
June 12, 2026
Choose website fonts that protect speed, readability and trust. Compare font files, weights, fallbacks, mobile legibility and loading strategy.
Read article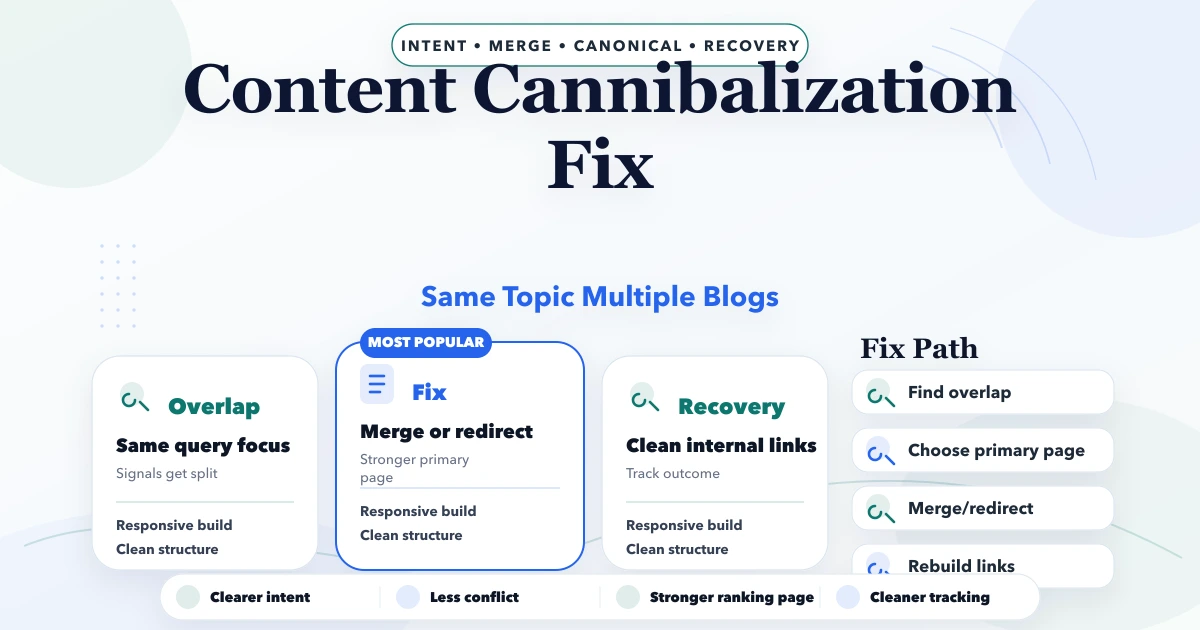
April 21, 2026
Diagnose content cannibalization with query and page evidence, then differentiate, consolidate, redirect, canonicalize, or de-prioritize overlapping URLs.
Read article