
May 30, 2026
Website Redesign Services in Delhi NCR
Website redesign services in Delhi NCR guide for SEO-safe redesign, speed, UX, content, redirects, pricing, and launch checklist.
Read articlePublished Updated
Diagnose why a polished website loads slowly. Trace hero media, fonts, scripts, CSS, hosting, render delay and mobile bottlenecks before changing the design.
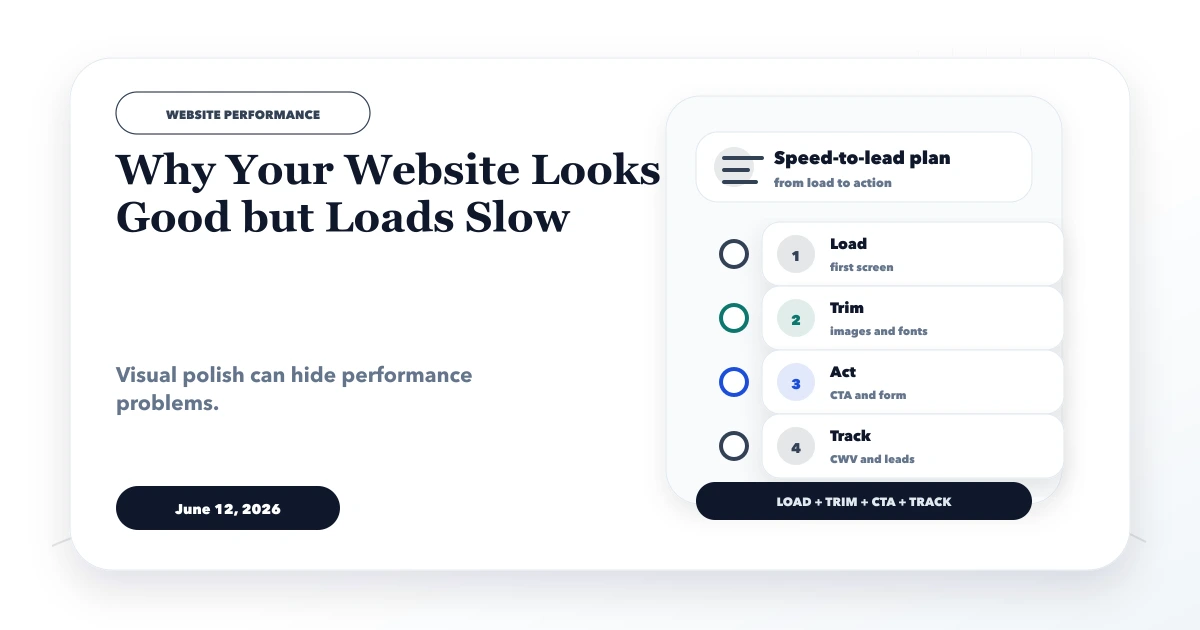
A website can look polished after it finishes loading and still feel broken during the first few seconds. The screenshot does not show a delayed headline, an empty hero, shifting buttons, a blocked menu, or a form that becomes usable late. These problems are caused by how the page is delivered and rendered, not by visual quality alone.
The right response is diagnosis, not immediate redesign. Removing every animation may leave the real bottleneck untouched. Buying faster hosting may not help if the main image is discovered late. This guide shows how to identify the cause before approving a fix.
Different symptoms point to different parts of the loading path.
| What the visitor experiences | Likely area to investigate |
|---|---|
| Blank or mostly blank screen | Render-blocking CSS, fonts, client rendering |
| Header appears but hero is late | LCP image or text render delay |
| Layout jumps after loading | Image dimensions, fonts, injected content |
| Page appears but taps do nothing | Main-thread JavaScript, hydration, third parties |
| First visit slow, repeat visit fast | Cache, compression, connection setup |
| Mobile slow but desktop acceptable | CPU, network, image sizing, script cost |
| One page slow, others fast | Page-specific media, widgets, data, component code |
| All pages slow | Shared layout, global CSS/JS, hosting, analytics, fonts |
Do not use one overall score as the diagnosis. Open the affected page, record what appears late, and inspect that element's network and rendering path.
A design tool shows the final state. A browser must assemble that state from HTML, CSS, fonts, images, JavaScript, and third-party responses. Each choice creates delivery work:
Visual ambition is not the problem. Unbudgeted implementation is. A well-built rich page can outperform a simple page that ships oversized assets and unnecessary code.
The largest above-the-fold image is often the Largest Contentful Paint element. Common mistakes include:
Google's LCP optimization guide recommends breaking LCP into response, resource delay, download, and render-delay parts. That prevents a team from compressing an image when the real problem is late discovery or JavaScript rendering.
The LCP element can be text. A hero heading may be present in the markup but delayed by:
If the main offer is text, make it readable without JavaScript. Motion can enhance the transition after the content is available. Review the website font performance guide before removing the brand face entirely.
Animated backgrounds, counters, carousels, particles, cursor effects, and continuous scroll listeners may look smooth on a powerful laptop. On a budget phone they can compete with navigation, layout, and input processing.
Inspect whether animation:
Keep motion that communicates hierarchy or feedback. Simplify motion that exists only to keep the screen busy.
Many marketing pages do not need every section to hydrate immediately. Yet a shared client component may include menus, animations, analytics wrappers, testimonials, sliders, forms, and modals in one bundle.
Warning signs include:
The solution can involve server rendering, static HTML, smaller client boundaries, delayed widgets, and route-level code splitting. The exact fix depends on the framework and page.
CSS is normally required before the browser can render a styled page, but oversized global styles increase the critical path. A site assembled from several component libraries may carry unused rules, duplicate resets, old themes, and animation definitions.
Check:
Do not inline the entire stylesheet as a shortcut. Reduce and organise the actual dependency.
Analytics, tag managers, chat, heatmaps, advertising pixels, review widgets, maps, videos, consent tools, and social embeds can each add requests and main-thread work.
Audit every third party with four questions:
Delay non-essential tools where consent and functionality allow. Do not remove measurement blindly; a fast page with no reliable lead data creates a different business problem.
CSS can display a huge file at a small size. The visitor still downloads the huge file. This commonly happens with logos, team photos, portfolio screenshots, and blog covers.
Create variants that match real display needs. Preserve aspect ratio, declare dimensions to prevent movement, and avoid shipping a desktop crop to every mobile visitor. The image optimization checklist covers format, sizing, loading, and visual quality.
Slow initial server response can matter, especially for uncached dynamic pages. But static pages can still be slow because of client resources. Before migrating hosting, check:
Changing the host will not automatically reduce a late animation, oversized image, or blocking font.
Use a private window or disable cache. Test the exact URL on mobile throttling and, if possible, a real mid-range phone.
Record whether it is the hero image, heading, full first screen, or interaction. Use the performance panel or PageSpeed diagnostics to identify the LCP element and long tasks.
Check when the HTML, stylesheet, font, LCP resource, and JavaScript start and finish. Late discovery and long download are different problems.
Temporarily test without the hero video, animation wrapper, chat, or extra font. This is diagnosis, not the final design decision.
If only the homepage is slow, focus on homepage content. If all pages share the issue, inspect global layout and common resources.
Lighthouse and PageSpeed lab tests provide a controlled diagnosis. Field data represents eligible real Chrome visits over time and may differ by device, location, and network. A new or low-traffic site may have no page-level field data.
Use lab tests to find probable causes and field data to confirm whether real users improve. Run several comparable tests; a single score can vary. The website audit checklist connects performance findings to crawlability and conversion.
Suppose a consultancy homepage looks excellent on desktop but shows the headline at 5.5 seconds on mobile. The hero has no image; the heading itself is LCP. The content is initially transparent, a web font is requested after CSS, and a motion library starts the reveal after hydration.
Compressing images would not solve that page. A focused fix could render the heading visibly in initial HTML, use a compatible fallback, and apply a short optional transition after first paint. This is an illustrative example, not a VASUYASHII client claim.
VASUYASHII starts with the affected URL and observed symptom. We identify the LCP element, network order, render delay, main-thread work, third parties, font behaviour, and layout movement. Only then do we decide whether to optimise, defer, replace, or remove an element.
For an existing site, contact us with the slow URL and device details. For a new build, our website development service treats the first screen as a performance budget, not only a design composition.
The browser may reuse cached fonts, scripts, styles, and images. A fast repeat visit does not remove the need to improve the first experience for a new lead.
No, but it can add images, JavaScript, layout work, and delayed discovery. If it is used, prioritise only the visible slide and verify that the slider adds real communication value.
Only when server response or delivery is a material part of the delay. Inspect the LCP breakdown before changing infrastructure.
Not automatically. Reduce unused files, improve loading and fallbacks, then compare. Brand typography may remain if its measured cost is controlled.
Mobile tests simulate or use slower networks and processors, smaller image needs, and different rendering constraints. JavaScript and oversized media often become more visible there.
Yes. Lab conditions, network timing, background activity, and third-party responses vary. Compare repeated runs under the same conditions and investigate the underlying metrics.
Capture the LCP element and network sequence before authorising a redesign. Once the real cause is known, use the lead-generation speed optimization plan to prioritise fixes around business impact.
Related Articles
May 30, 2026
Website redesign services in Delhi NCR guide for SEO-safe redesign, speed, UX, content, redirects, pricing, and launch checklist.
Read article
March 30, 2026
Choose business hosting in India by workload, region, backups, security, support, staging, ownership, migration, email boundaries, and total cost.
Read article
May 18, 2026
Improve Shopify speed with a practical India-focused audit for themes, apps, images, scripts, Core Web Vitals, release testing, and conversion trade-offs.
Read article
June 1, 2026
Plan a Delhi NCR website redesign with content inventory, SEO migration, UX, performance, analytics, acceptance and practical budget bands.
Read article