May 7, 2026
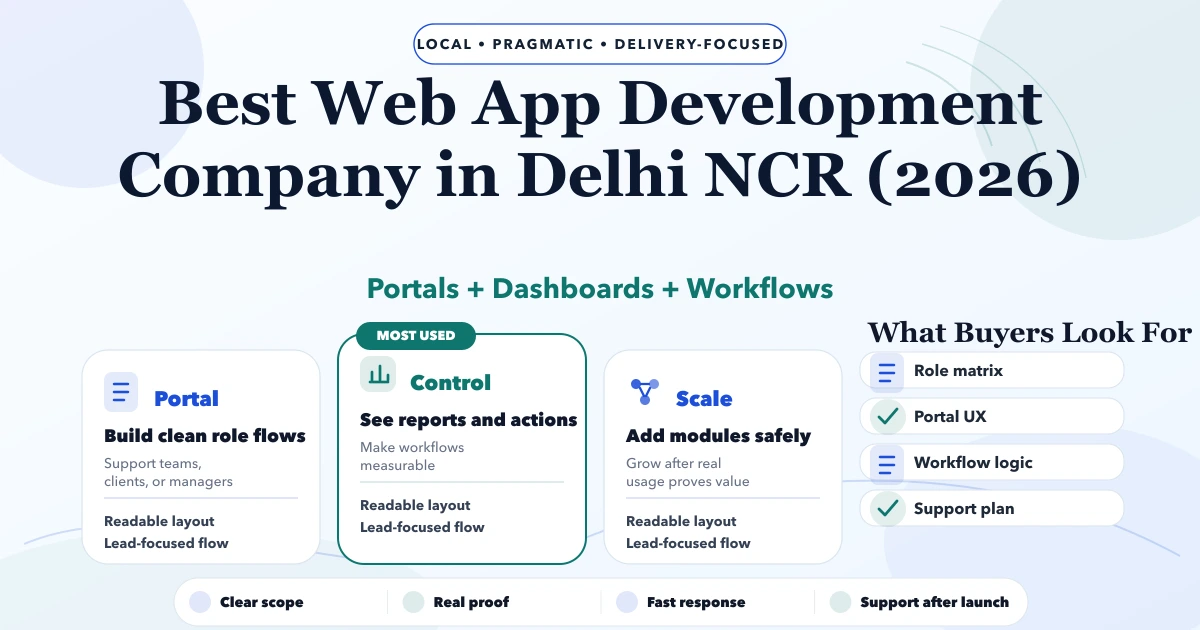
Best Web App Development Company in Delhi NCR (2026)
Best Web App Development Company in Delhi NCR (2026) guide with pricing, process, timeline, deliverables, proof links, and practical planning for businesses.
Read articlePublished
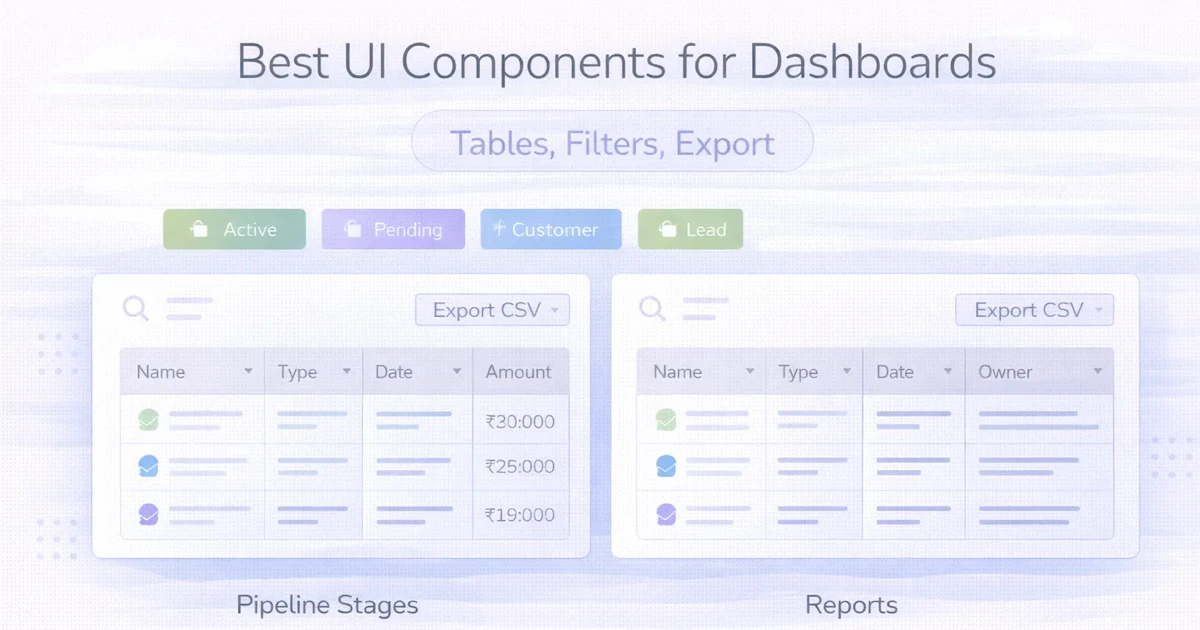
Best UI components for dashboards: tables, filters, export flows, and practical design guidance for admin panels in 2026.
Many dashboards fail because they look polished in screenshots but feel slow, confusing, or frustrating in actual daily use. The issue is rarely colors or cards. The issue is usually weak information hierarchy and poor component decisions.
If users work inside a dashboard every day, the components matter a lot. Tables must be readable. Filters must reduce effort instead of adding clicks. Export flows must be reliable. Bulk actions must be obvious. Status and empty states must be clear.
This guide covers the UI components that matter most in real dashboards, how to structure them, and what teams should budget if they are building a serious admin panel.
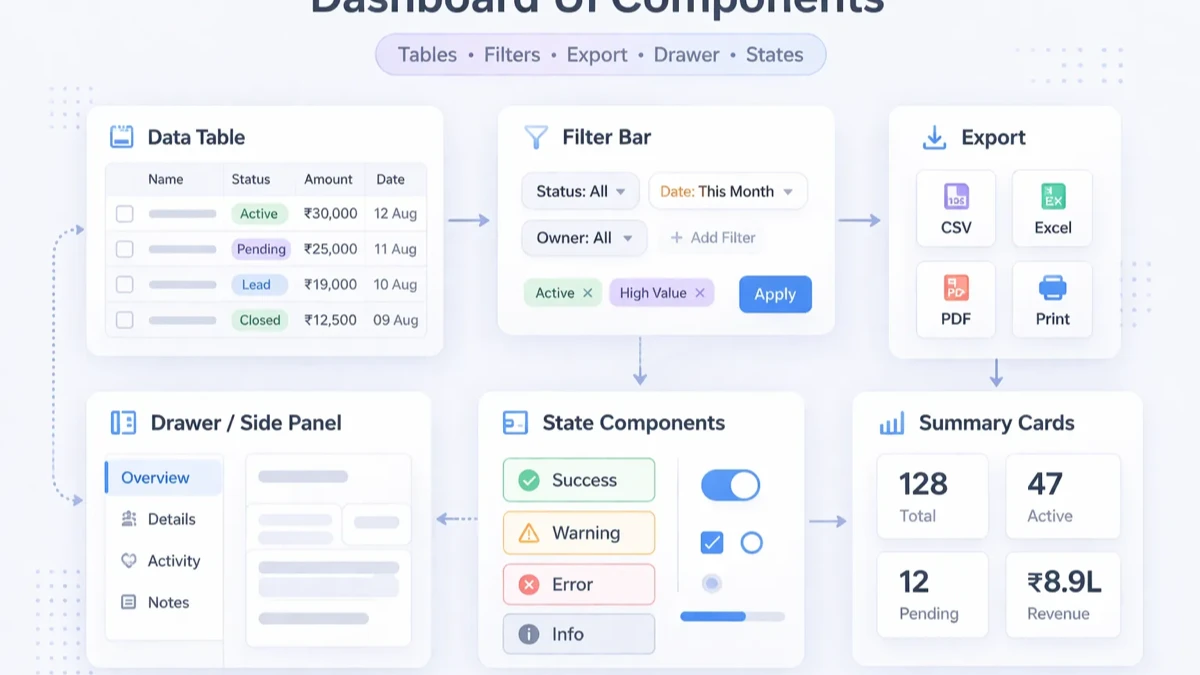
The most valuable dashboard components are usually:
If these components are designed well, dashboards feel efficient. If they are weak, even simple workflows feel heavy.
Typical custom dashboard UI implementation cost:
₹35,000 to ₹80,000₹80,000 to ₹2 lakh₹2 lakh to ₹5 lakh+Use these for:
Do not overload them with too many numbers.
This is the most important component in many dashboards. A weak table destroys usability fast.
Filters should help users narrow data quickly, not feel like a long form.
Use drawers, side panels, or modal views to inspect row details without losing the main context.
These are not minor screens. They directly affect clarity when there is no data or something fails.
Related reading:
The best table is not the one with the most controls. It is the one that supports the user's common task with the least friction.
If there are too many columns:
Good filters usually include:
Use defaults carefully. Too many default filters create confusion.
Exports should answer:
This sounds simple, but many dashboards get it wrong and users stop trusting the export.
₹35,000 to ₹80,000Usually includes:
₹80,000 to ₹2 lakhUsually includes:
₹2 lakh to ₹5 lakh+Usually includes:
Timeline usually looks like:
1 to 2 weeks: compact dashboard UI3 to 5 weeks: operational dashboard5 to 8 weeks: advanced multi-role dashboardA practical stack for dashboards:
Next.js for app structureThe real priority should be consistency, performance, and clarity under heavy data use.
Dashboard UI cost is mostly driven by:
The common mistake is underestimating state design. Loading, empty, error, partial-data, and success states all need real UI thinking.
If your dashboard users work in tables all day, do not optimize for screenshots. Optimize for speed, clarity, and repeated actions. That is what makes an admin panel feel genuinely good.
In many dashboards, the table is the most important component because that is where daily work happens.
Use inline filters for common quick actions and a panel for secondary filters.
Export should be visible wherever it is a routine task, especially on reporting and data-heavy screens.
Yes. It remains useful in data-heavy screens, especially when server-side filtering is used.
No. High-frequency actions should stay visible, while secondary actions can sit in a menu.
If users cannot scan the row quickly, the table is overloaded. Move lower-priority details out.
Not always. But reusable component rules are important once the dashboard grows beyond a few screens.
Better table hierarchy, clearer filters, and predictable export behavior usually improve usability the fastest.
If your team is building a dashboard for actual operations, start with the core actions, table structure, filter logic, and export behavior before polishing visual details.
Related Articles
May 7, 2026
Best Web App Development Company in Delhi NCR (2026) guide with pricing, process, timeline, deliverables, proof links, and practical planning for businesses.
Read article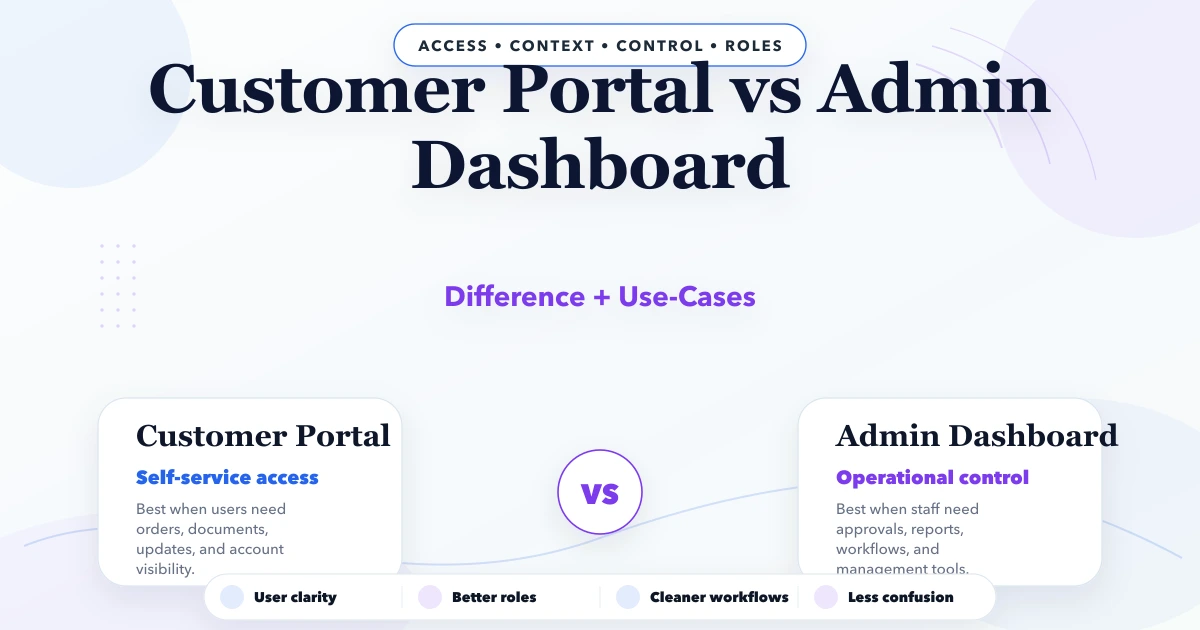
April 22, 2026
Customer portal vs admin dashboard (difference + use-cases): practical features, cost, timeline, implementation checklist, and real-world guidance for Ind.
Read article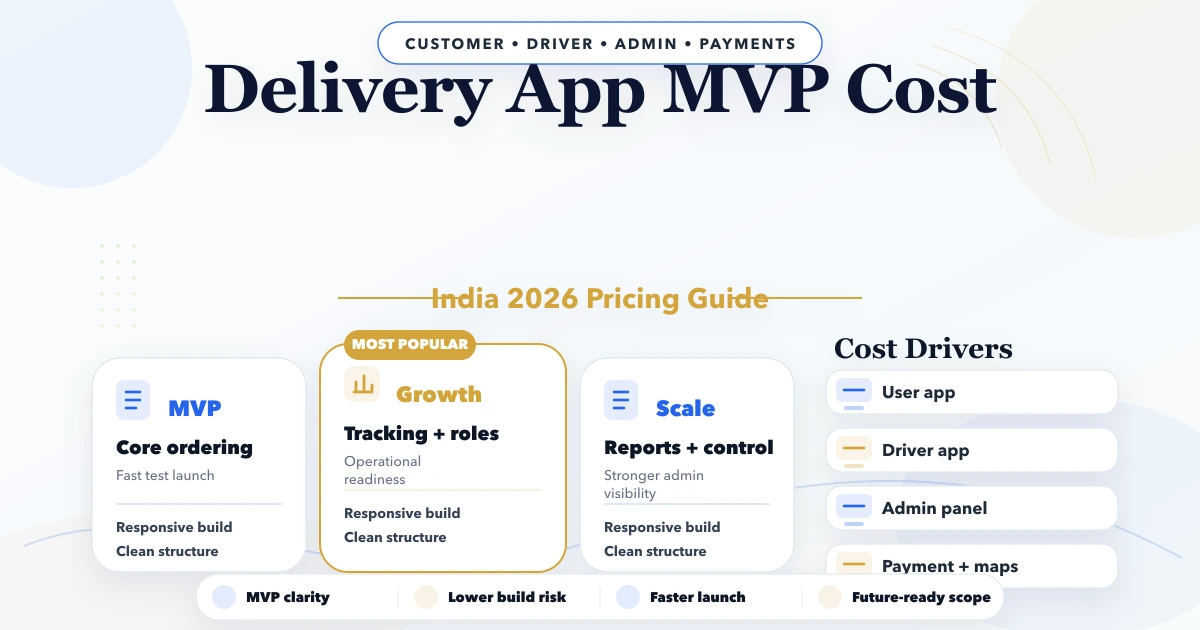
April 22, 2026
Delivery app MVP cost (India 2026): practical features, cost, timeline, implementation checklist, and real-world guidance for Indian SMBs in 2026.
Read article