
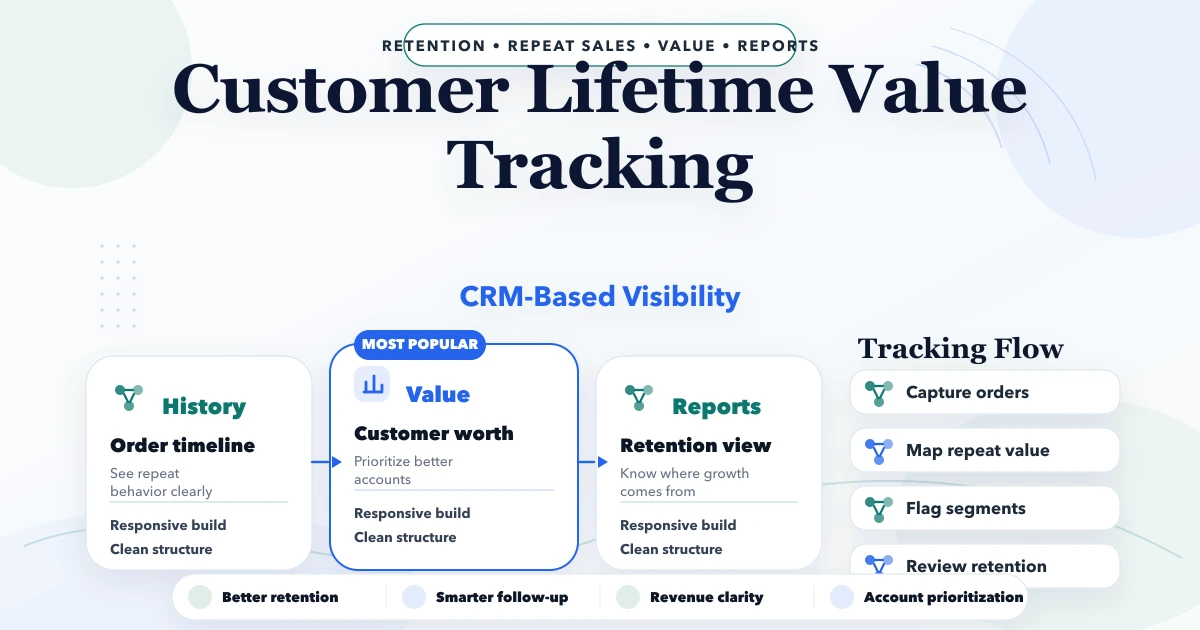
April 23, 2026
Customer Lifetime Value Tracking System for SMEs
Design a customer lifetime value tracking system with identity matching, margin-aware formulas, cohorts, retention actions, data controls, and CRM integration.
Read articlePublished Updated
Build a reliable SMB sales dashboard with defined pipeline, conversion, revenue, collection, product, customer, rep, target, and data-quality KPIs.
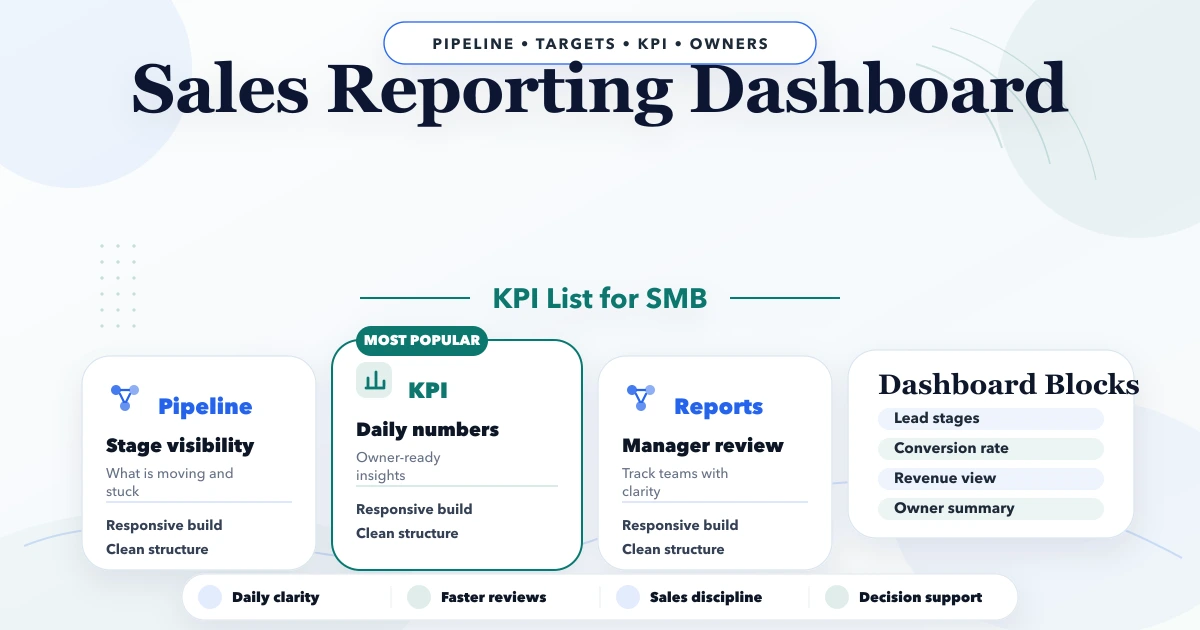
A sales dashboard should answer decisions, not display every field stored in the CRM or billing system. For an owner, useful questions include: Are qualified opportunities growing? Which deals need action? What converted this period? What was invoiced, collected, returned, or left overdue? Which product, customer, channel, branch, or salesperson explains the change?
The dashboard becomes trustworthy only when every KPI has a definition, source, time boundary, owner, and reconciliation rule. A polished chart built on inconsistent stages or duplicate customers creates faster confusion.
An SMB sales dashboard usually needs five layers:
Do not combine these layers until their source events are defined.
For every metric, record:
| Contract field | Example question |
|---|---|
| Name | Is sales order value, invoice value, or collected amount? |
| Formula | Which amounts, statuses, and adjustments are included? |
| Grain | Lead, opportunity, order, invoice, line item, payment, or account? |
| Time basis | Created, won, ordered, invoiced, delivered, or paid date? |
| Scope | Company, branch, team, territory, or owner? |
| Exclusions | Test records, cancelled orders, tax, returns, internal accounts? |
| Source | CRM, order system, billing, payment, or approved snapshot? |
| Owner | Who approves definition changes and investigates mismatch? |
Without this contract, two correct-looking dashboards may report different numbers.
The pipeline needs explicit stages with entry and exit rules. A common structure might be New, Contacted, Qualified, Proposal, Negotiation, Won, and Lost, but names alone are insufficient.
For each stage define:
If staff can move a lead directly from New to Won without an order or invoice link, the dashboard must represent that intentionally rather than assume a complete funnel.
Sum the approved value of open qualified opportunities. Show count alongside value so one large deal does not hide a weak pipeline.
Apply documented stage probabilities only when they are based on observed history or an approved forecasting policy. A percentage typed by salespeople is a confidence note, not objective probability.
Measure time since the last valid stage entry, not merely the opportunity creation date. Highlight records beyond stage-specific thresholds.
Percentage of open qualified opportunities with a future next action, owner, and due date. This is often more actionable than another chart.
Show new, advanced, regressed, won, lost, and reopened opportunities during the period. A closing snapshot alone hides activity.
Qualified leads / eligible leads created in the cohort. Define eligibility and observe mature cohorts so recent leads are not unfairly counted as failures.
Use a consistent denominator such as Won divided by Won plus Lost for opportunities closed in the period. Keep open opportunities out of the closed-outcome rate.
Measure from an agreed starting event to Won. Report median and percentiles because one delayed deal can distort the average.
Track how cohorts move between consecutive stages. This identifies where qualification, proposal, approval, or follow-up breaks.
Use a short controlled category plus optional customer wording. Review reasons instead of allowing Other to become the largest category.
Sales teams often mix booked orders, invoices, recognised revenue, and cash. Display them separately.
Finance should approve revenue definitions. The dashboard must not silently become the accounting ledger.
An owner may report strong sales while cash remains stuck. Useful collection views include:
Link summaries to the authorised invoice or account detail rather than asking staff to rebuild lists in spreadsheets.
Line-item data supports:
Do not publish profit when purchase cost, landed cost, returns, tax, and allocations are incomplete. Label gross contribution or estimate honestly.
Use metrics staff can influence and explain. Examples include qualified opportunities created, next-action coverage, stage movement, proposals sent, won value, collections supported, response time, and data completeness.
Avoid ranking employees only by revenue without territory, account allocation, product mix, leave, team support, and deal ownership context. Define shared deals and reassignment history.
Access must also be role-based. A salesperson may see own records, a manager the team, and an owner consolidated results. Enforce scope in backend queries and exports, not only hidden filters.
Store target versions with period, unit, scope, approver, and effective date. Do not overwrite a target after the period begins without preserving history.
Compare actual, target, and forecast only when they share the same basis. An invoice-value actual cannot be compared fairly with an order-value target.
Forecasts can combine open pipeline, probability, expected close date, capacity, and historical conversion. Show assumptions and allow the owner to inspect the contributing deals.
Focus on due actions, new qualified leads, stalled deals, proposals awaiting response, collections due, and data exceptions.
Review pipeline movement, stage ageing, conversion, loss reasons, rep/team activity, collections, and forecast changes.
Compare trends across orders, invoices, net sales, collections, customers, products, branches, targets, and data-quality health.
Each view answers different decisions. Do not place all charts on one screen.
Useful filters may include date basis, company, branch, team, salesperson, territory, channel, customer segment, product, stage, and source. Filters need clear defaults and permission scope.
Every summary should drill into the contributing records when authorised. Preserve the filter context and show calculation notes so users can reconcile totals.
Link lead, opportunity, customer, order, invoice, payment, return, product, user, and branch through stable identifiers. Names and phone numbers are not reliable join keys.
Choose one source of truth for each event:
Keep snapshots when historical reporting must preserve what was known at period close.
The dashboard should reveal its own reliability:
A warning is more honest than a precise total built on incomplete data.
Alerts should lead to an owner and action. Examples:
Deduplicate alerts and define stop conditions. Repeated messages without workflow ownership become noise.
Our implementation begins with an approved spreadsheet containing sample records and expected totals for one period. We build each KPI against that acceptance set, then test role scope, late entries, cancellations, returns, reassignment, and period cutoffs. A metric is not accepted because its chart looks correct; it must reconcile to source records.
This method improves auditability but is not a guarantee of a sales outcome. Better decisions still require accurate staff updates, a viable offer, management follow-up, and customer demand.
sales interchangeably;Start with qualified pipeline, stage ageing, next-action coverage, win rate, cycle time, orders/invoices under a clear basis, collections, overdue exposure, and data quality.
No. A dashboard reads and summarises operational data. Staff still need a reliable system to capture leads, stages, activities, orders, invoices, and payments.
Match the business decision. Daily operating queues may need near-real-time updates; weekly and monthly snapshots should favour reconciliation and stability.
Only when the cost and adjustment policy is complete and approved. Otherwise show net sales or a clearly labelled estimate.
It can validate definitions and expected totals. A system becomes useful when repeated imports, permissions, drill-down, history, automation, and multiple users make manual reporting unreliable.
Cost depends on source systems, data cleanup, workflow capture, KPI complexity, role scope, history, integrations, exports, and support. Define the acceptance dataset before requesting a quote.
Choose one completed month and write expected totals for pipeline movement, orders, invoices, returns, collections, and overdue exposure. Reconcile definitions before designing charts. Contact VASUYASHII for a scoped web application or reporting dashboard review.
Related Articles
April 23, 2026
Design a customer lifetime value tracking system with identity matching, margin-aware formulas, cohorts, retention actions, data controls, and CRM integration.
Read article
May 22, 2026
sales pipeline automation for small businesses: practical 2026 guide with examples, INR cost, workflow setup, timeline, mistakes, FAQs, and Indian SME tips.
Read article
May 16, 2026
Define trustworthy SaaS analytics KPIs for acquisition, activation, retention, revenue, churn, support, reliability, cohorts, event quality, and ownership.
Read article
May 23, 2026
Plan multi-branch business software with company scope, branch permissions, stock transfers, shared masters, approvals, consolidation, and reliable reports.
Read article