
April 23, 2026
Sales Dashboard KPI List for Small Businesses
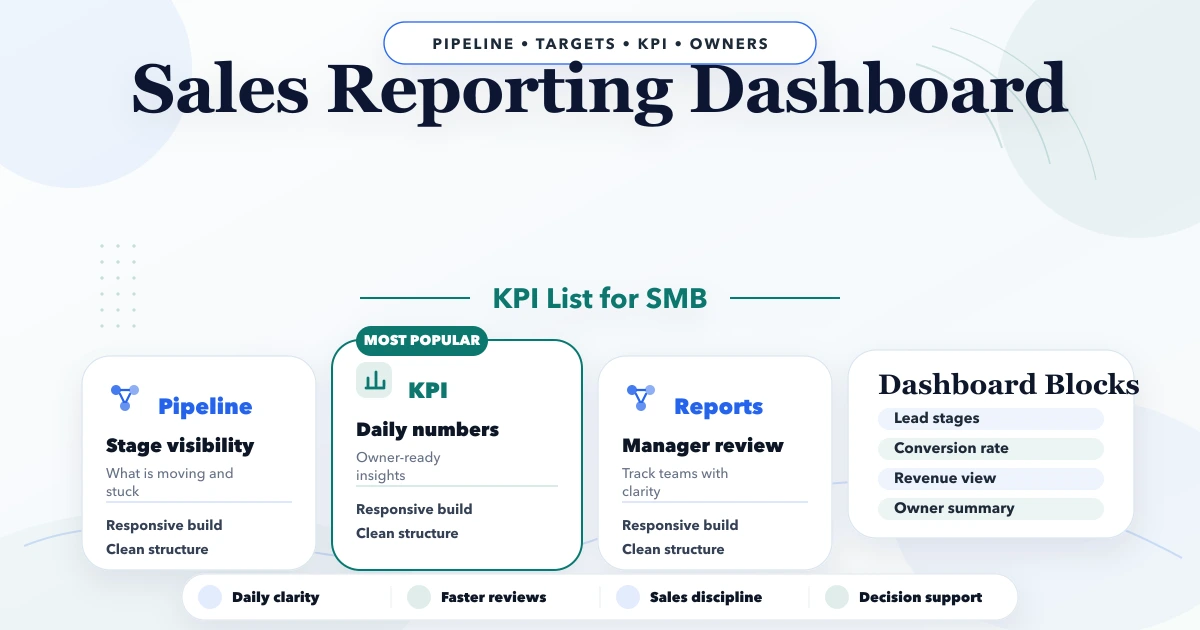
Build a reliable SMB sales dashboard with defined pipeline, conversion, revenue, collection, product, customer, rep, target, and data-quality KPIs.
Read articlePublished Updated
Design a customer lifetime value tracking system with identity matching, margin-aware formulas, cohorts, retention actions, data controls, and CRM integration.
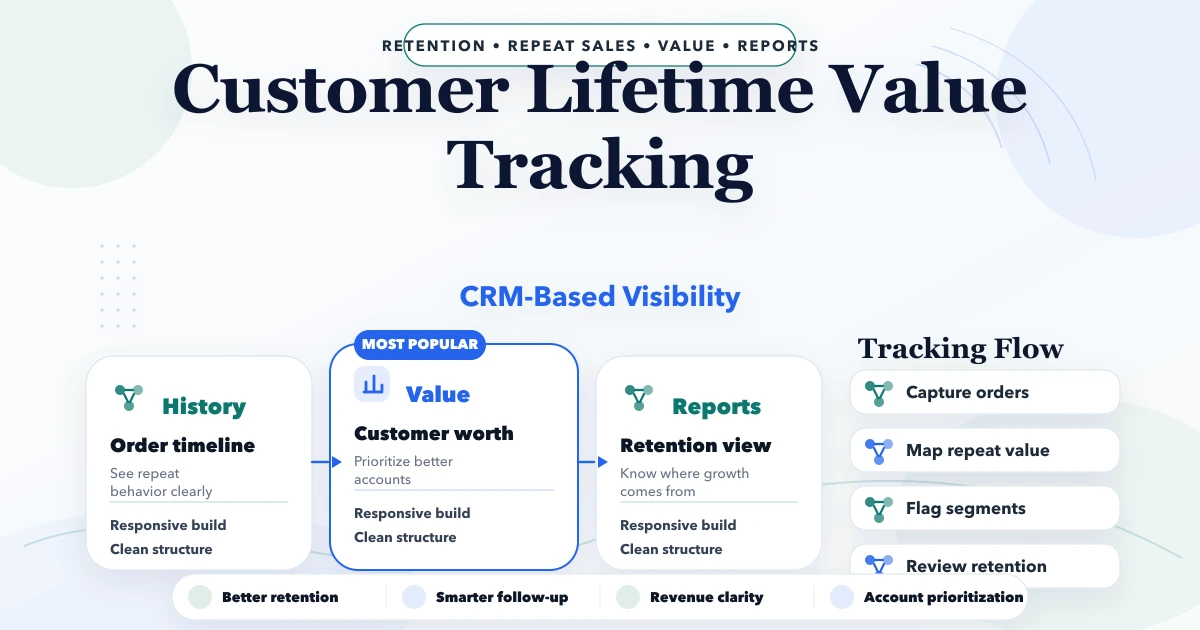
A customer lifetime value dashboard is useful only when the business agrees on three things: who counts as the same customer, which value formula is being used, and what decision follows from the result. Adding all invoice totals under a phone number can look precise while hiding returns, discounts, duplicate accounts, and inactive periods.
For an Indian SME, the first practical version often begins with customer identity, completed sales, returns, payment status, and repeat-purchase timing. Acquisition cost, support effort, and predicted future value can come later when the data is trustworthy.
By Tushar C. (Founder, VASUYASHII). This guide explains software and reporting design. It does not provide accounting, tax, financial-advisory, or guaranteed-retention outcomes. Every metric should display its definition, period, source, and exclusions.
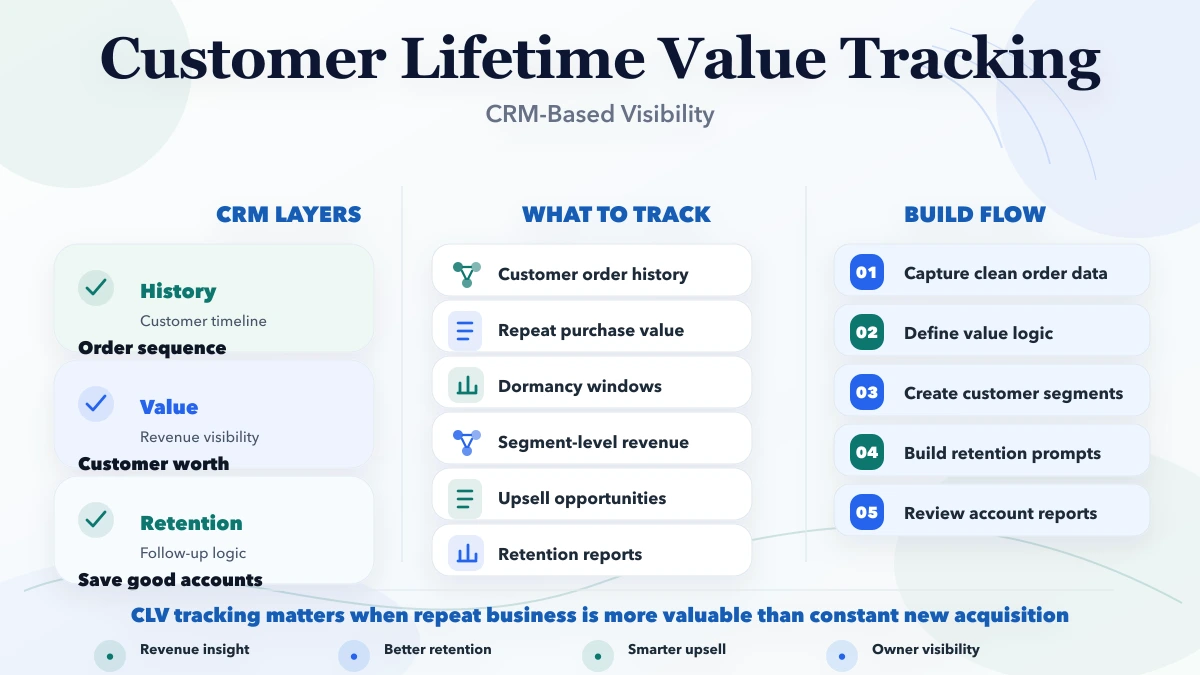
Start with realized customer value, not an ambitious prediction model. Match customer records, include completed invoices or orders, subtract returns and approved discounts, choose revenue or contribution-margin logic, and group results by a fixed period. Then use the report for a specific action such as repeat-order outreach, account review, service follow-up, or credit-policy discussion.
Several formulas may be valid, but they answer different questions.
Completed sales - returns - cancelled value - approved discounts
This is the easiest starting metric. It shows money billed or sold after defined adjustments, but it does not show profitability.
Net revenue - cost of goods or direct service cost - customer-specific fulfilment cost
This is more useful for prioritization but requires reliable cost data. Do not display contribution value if purchase cost, landed cost, or service effort is incomplete.
Expected order value × expected purchase frequency × expected active period × margin factor
Prediction requires stable cohorts and enough history. It should show assumptions and confidence rather than one unquestionable number.
A hardware retailer buys from a supplier eight times in a year. Gross invoices total ₹4,80,000. One return is ₹25,000, approved discounts total ₹12,000, and direct delivery cost allocated to the account is ₹9,000. Historical net revenue is ₹4,43,000; a margin-aware value needs valid product cost before it can be calculated.
If the same retailer appears under “Aarav Hardware,” “Aarav Electrical,” and two phone numbers, the dashboard may split that history into three customers. Identity cleanup matters before visualization.
| Data area | Key fields | Control needed |
|---|---|---|
| Customer identity | Stable ID, business name, GSTIN, contacts | Merge and split history |
| Transactions | Invoice/order ID, date, value, status | Exclude drafts and cancellations |
| Adjustments | Returns, credit notes, discounts | Link to original transaction |
| Cost basis | Product or service direct cost | Version and period definition |
| Acquisition | First known source, campaign cost | Attribution boundary |
| Activity | Last order, enquiry, support interaction | Define what counts as active |
| Segment | City, category, channel, account tier | Controlled labels, not free text |
Customer IDs should remain stable when a contact changes. GSTIN can help business matching but may not exist for every customer and should not be exposed unnecessarily. Merges need an audit record because an incorrect merge can corrupt invoices, payments, and reports.
Use deterministic matching first: exact customer ID, verified GSTIN, or approved account mapping. Phone and email can suggest a match but should not automatically merge two companies. Provide a review queue showing the fields that triggered the suspected duplicate.
When one group operates several firms, decide whether the report needs company-level, branch-level, and group-level views. Keep the underlying transactions company-scoped even when management receives an aggregated report.
Do not label a customer “bad” or “low quality” from one metric. Segments should guide a business review, not automate unfair treatment.
An owner view can show total customers included, historical net value, repeat rate, median order gap, customers by value band, and accounts needing review. Every card should link to the underlying customer list and display the reporting period.
The customer detail view should show value composition: completed transactions, returns, discounts, direct cost if available, first and last purchase, average order value, and recent activity. Users need to understand why the number changed.
A CRM stores enquiries, contacts, follow-ups, and opportunity context. Billing or order software provides realized transactions. CLV reporting often needs both, but the transaction system should remain authoritative for completed sales and returns.
VASUYASHII Business Suite includes customer records, invoices, purchases, payments, and business reporting within its current ERP-lite scope. Those records can support basic historical customer-value analysis. Advanced acquisition attribution, predictive CLV, and complete margin accounting should be treated as separate custom reporting requirements, not implied current features.
If a business needs a connected reporting layer, review software development services and define API, refresh, reconciliation, and permission rules before building charts.
A report should create a controlled work queue. Examples include asking a salesperson to review high-value inactive accounts, reminding approved customers about replenishment, checking a service issue before outreach, or comparing reorder intervals by product category.
Avoid bulk WhatsApp messages simply because a customer appears in a segment. Confirm consent, relevance, frequency, and template rules. Record campaign and response outcomes without placing personal details in analytics tools.
Set a review cadence before automating outreach. A weekly owner review may be enough for a small sales team, while a monthly cohort review can reveal whether acquisition quality or repeat behaviour is changing. Record why an account entered a segment and when it should leave. Without exit rules, customers can keep receiving irrelevant follow-ups after they purchase, opt out, become inactive for a valid reason, or move to a different account structure.
The main cost is not the chart. It is data cleanup, source integration, identity rules, margin definition, reconciliation, permissions, and ongoing ownership. A focused historical report using one clean billing source is smaller than a predictive multi-channel CLV platform.
Ask vendors to scope source systems, transaction volume, duplicate handling, refresh frequency, cost allocation, filters, exports, audit history, and acceptance tests. A demo with synthetic data does not prove that real customer records reconcile.
No. Total sales is one historical input. CLV may use net revenue, contribution margin, active period, purchase frequency, and future assumptions depending on the chosen definition.
That depends on whether the metric uses billed sales, recognized revenue, or collected value. Show dues separately and document the rule consistently.
Yes for a clean, limited dataset. A custom system becomes useful when transactions come from several sources, identities need controlled matching, permissions matter, or reports must refresh repeatedly.
Historical reporting can begin with a meaningful operating cycle, often 12 months. Prediction needs enough stable history to represent repeat behavior and seasonality; there is no universal minimum.
No. Consider margin, dues, support burden, strategic importance, current need, and consent. CLV is a decision input, not an automatic customer-treatment rule.
Review unmatched transactions, suspected duplicates, value changes caused by returns, segment sizes, and whether staff complete the actions generated by the report.
Choose 50 customers and reconcile their last 12 months of invoices, returns, discounts, and payment status manually. That sample will reveal whether the business is ready for a reliable dashboard.
Related Articles
April 23, 2026
Build a reliable SMB sales dashboard with defined pipeline, conversion, revenue, collection, product, customer, rep, target, and data-quality KPIs.
Read article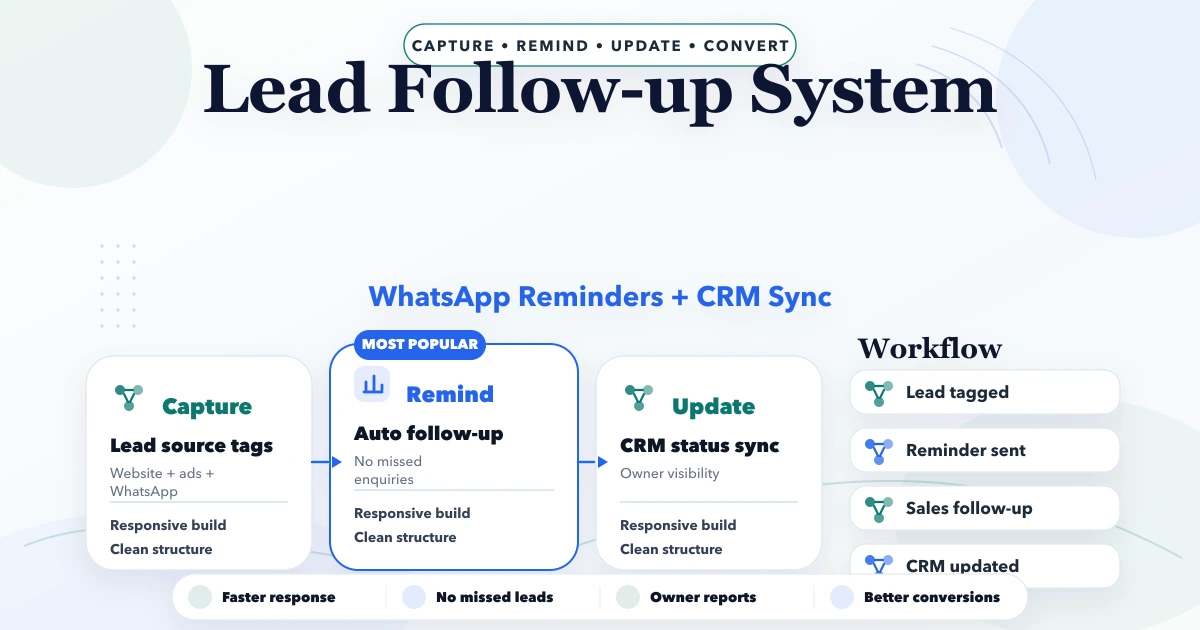
April 21, 2026
Design a lead follow-up system with source capture, qualification, ownership, next actions, WhatsApp reminders, CRM stages, consent, reports and controls.
Read article
May 26, 2026
manufacturing production tracking system: practical 2026 guide with features, INR pricing, roadmap, tech stack, mistakes, FAQs, and Indian SMB tips today.
Read article
May 25, 2026
Design CRM call tracking for ads, SEO, referrals, and direct leads with source capture, deduplication, consent, outcomes, offline conversion, and reporting.
Read article