
June 1, 2026
Inventory Software Cost in India (Custom)
Compare custom inventory software cost in India by stock workflow, migration, barcode and integrations. Includes a quote checklist and stock acceptance example.
Read articlePublished Updated
Plan a custom reports dashboard with metric definitions, source mapping, sales and stock views, role access, refresh rules, reconciliation, and alerts.
A custom reports dashboard is useful only when every number has an approved definition and can be traced to source transactions. Adding charts before fixing duplicate customers, inconsistent invoice status, missing stock movements, or unclear staff ownership creates a polished disagreement rather than better control.
This guide shows how to design sales, inventory, payment, purchase, expense, and staff reporting for an Indian SME. The emphasis is on decisions, data contracts, reconciliation, permissions, and failure states rather than visual decoration.
Start with five to eight management questions, not a list of chart types. For each question define:
Build the first dashboard only after those definitions are signed off with sample data.
Examples of useful questions:
Each question should lead to a responsible action. A dashboard full of vanity totals does not improve operations.
Create a version-controlled metric dictionary before development:
| Metric | Definition questions |
|---|---|
| Sales | Invoice date or payment date? Tax-inclusive? Cancelled/returned invoices excluded? |
| Collection | Payment received, cleared, or allocated? Refunds included? |
| Customer due | Invoice balance as of which date? Credit notes and unallocated payments? |
| Stock quantity | Available, on-hand, reserved, damaged, or in transit? |
| Inventory value | Purchase cost, weighted average, FIFO, or standard cost? |
| Gross margin | Which cost and return rules? Is it an estimate or accounting figure? |
| Staff performance | Activity, qualified outcome, revenue, or SLA? |
Display the definition or help text where users can find it. Never use “profit” for a simple sales-minus-purchase estimate if payroll, overhead, tax, returns, and accounting rules are excluded.
Map each dashboard area to the authoritative system:
When several tools contain the same concept, choose the owner and sync direction. For example, the CRM may own lead stage while billing owns invoice status. Copying both into a spreadsheet does not resolve the conflict.
Define the smallest record represented by each dataset: invoice, invoice line, payment, stock movement, lead activity, daily snapshot, or staff shift. Mixing grains causes double counting.
Useful dimensions include:
A payment joined directly to invoice lines can multiply the payment amount. Aggregate at the correct grain before combining datasets.
Separate commercial and cash views:
Clicking a total should open the transaction list with the same filters. Exported totals must match the visible dashboard.
Useful inventory controls include:
Do not calculate inventory from product quantity fields if a stock ledger exists. Rebuild quantities from accepted movements or reconcile the summary to the ledger.
Staff dashboards should measure role-appropriate outcomes, not surveillance. Examples:
Use individual metrics only when definitions, data quality, and incentives are fair. Activity count alone can reward low-value clicks.
Use a stable hierarchy:
Cards should not resize as numbers load. Long labels need responsive constraints. Tables need sticky context, useful empty states, and mobile alternatives rather than horizontal overflow without guidance.
Not every report needs real-time data. Define:
| Refresh type | Suitable use |
|---|---|
| Transactional/current | Active orders, payments, stock exceptions |
| Near real time | Operational dashboard with short processing delay |
| Scheduled | Daily/weekly management summaries |
| Period snapshot | Month-end stock, ageing, historical pipeline |
Show the last successful refresh and source coverage. If one integration fails, do not silently display an incomplete “current” total.
Snapshots matter when historical answers depend on data that later changes. Customer due “as of 31 March” cannot always be reproduced from today's status without dated transactions or snapshots.
Alerts should point to an owner and next action. Examples:
Avoid sending every alert to every manager. Use severity, cooldown, grouping, acknowledgement, and escalation. A red dashboard nobody owns is noise.
Apply the same company and role boundaries to reports as transactional screens. A salesperson may see assigned leads; a branch manager may see one branch; an owner may see company totals; a platform admin should not automatically see customer financial data without an authorised support process.
Control:
Test direct API/report URLs, not only hidden menu items.
Every financial or stock dashboard needs a reconciliation pack:
Repeat after migrations, tax-rule changes, new integrations, or major releases.
Current VASUYASHII Business Suite visibly includes dashboard summaries and reporting around products, invoices, purchases, payments, expenses, stock, and company-scoped operations. This provides first-party context for metric and permission decisions. Advanced BI, custom accounting statements, payroll analytics, manufacturing, and cross-system warehouse reporting remain separate modules unless explicitly scoped.
Review the Business Suite product page for current product boundaries.
Use existing product reports when definitions and workflows fit. Build a custom dashboard when the business needs:
Custom reporting should not become a substitute for fixing source-system data.
Cost depends on source systems, API access, historical data, metric count, data cleaning, refresh rate, dimensions, permissions, alerts, exports, mobile design, scheduled delivery, and reconciliation.
A dashboard reading one clean database is smaller than a reporting layer combining CRM, billing, ecommerce, payments, inventory, and spreadsheets. Ask for a metric dictionary and source map before accepting a fixed estimate.
Decision questions, metric dictionary, source map, role scope, sample reconciliation.
Priority totals, exceptions, trends, drill-down, filters, and audit-friendly exports.
Alerts, scheduled reports, snapshots, additional sources, branch/company comparison, and advanced analysis.
Use custom software services for connected reporting scope and integration services for source sync.
Chart type cannot resolve an undefined metric.
Sales and collection answer different questions. Keep them separate.
Show refresh timestamp and failure state.
Hidden navigation is not data security. Enforce scope in the API/query.
Restrict customer, cost, margin, and staff exports.
Include quality, outcome, SLA, and role context.
Start with five to eight decisions and their supporting drill-downs. Add metrics after managers use and trust the first set.
Only where operational decisions require it and sources support reliable refresh. Scheduled reporting is enough for many management views.
Temporarily, with ownership, schema validation, version control, and clear refresh rules. It should not be an untracked master copied by many users.
Reconcile counts and amounts with source transactions for approved periods and edge cases, then record sign-off.
Yes, but define recipients, data sensitivity, delivery security, schedule, failure alerts, and revocation.
Share decision questions, sample reports, source systems, data fields, companies/branches, users, refresh needs, and known reconciliation problems.
Use the report automation guide and admin dashboard best practices to refine delivery. For implementation, review web application services or contact VASUYASHII.
Related Articles
June 1, 2026
Compare custom inventory software cost in India by stock workflow, migration, barcode and integrations. Includes a quote checklist and stock acceptance example.
Read article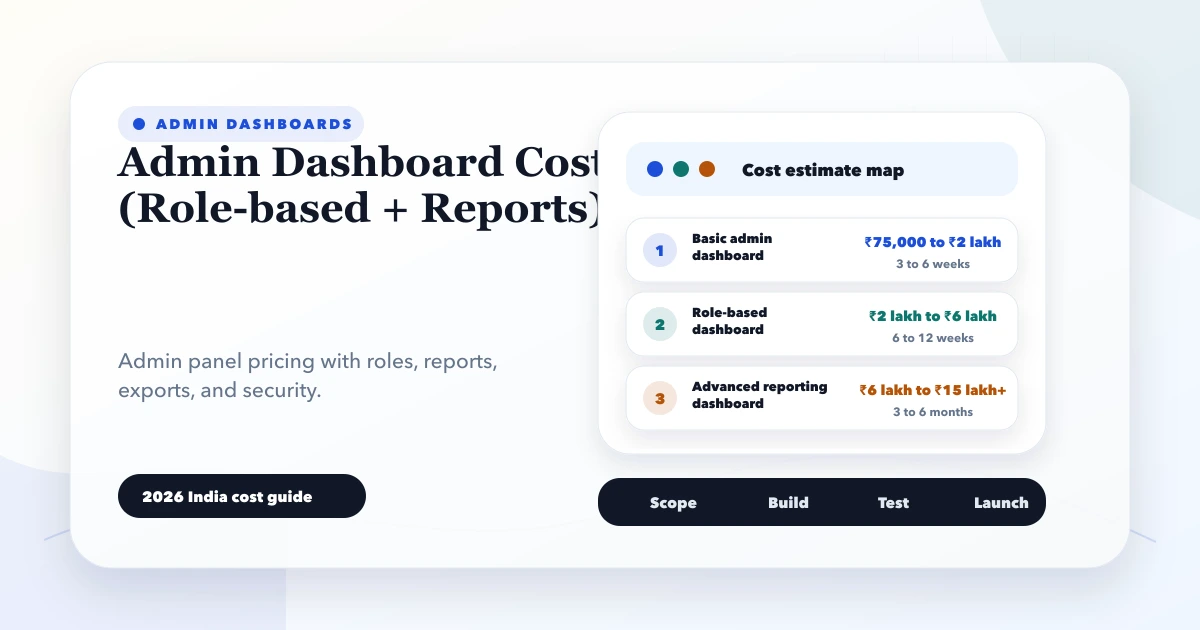
May 28, 2026
Estimate admin dashboard cost in India by workflows, roles, reports, integrations, data volume, security, testing, deployment, and ongoing operational support.
Read article
May 24, 2026
Plan warehouse inventory software for receiving, put-away, bins, picking, dispatch, returns, transfers, counts, adjustments, barcodes, and stock reports.
Read article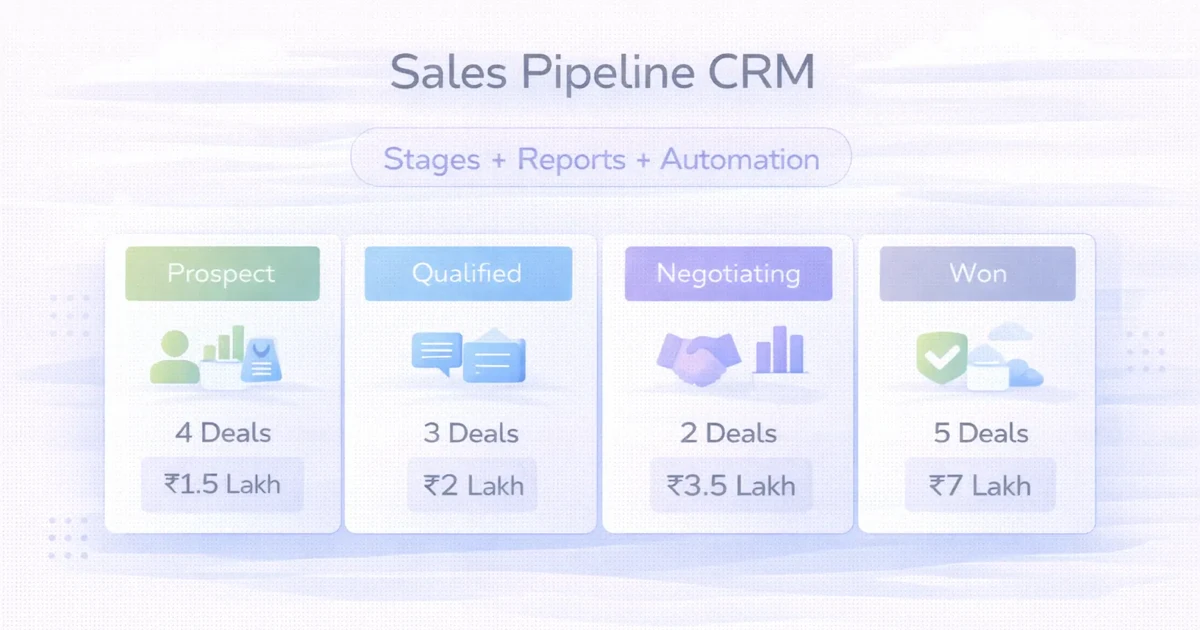
April 2, 2026
Design a sales pipeline CRM with clear stages, ownership, follow-ups, reports, automation, cost ranges, and rollout guidance for SMEs.
Read article